

OPEN CHRONICLE EXPLAINED · MONEY & ECONOMY · HOW THE WORLD WORKS
Once a defining language of Wall Street, technical analysis has been challenged by academic finance, powerful computers and algorithmic trading. Yet charts remain everywhere. Has chartism become obsolete, or has its most useful legacy simply changed names?
By Open Chronicle Explained
The strange survival of the financial chart
Walk into almost any modern trading environment and one familiar object remains visible: the price chart.
Screens display candlesticks, moving averages, trading volumes, support levels and trend lines. Financial websites offer increasingly sophisticated charting tools. Millions of individual investors use them to decide when to buy or sell stocks, currencies, commodities and cryptocurrencies.
Yet much of professional finance has moved in another direction.
Institutional investors employ economists, statisticians, programmers and quantitative researchers. Algorithms can process enormous datasets, identify statistical relationships and execute trades in fractions of a second. Investment firms increasingly evaluate companies through earnings, cash flows, valuation models and economic fundamentals.
Against that background, drawing lines across historical prices can appear almost antiquated.
But there is a paradox.
Some of the ideas associated with technical analysis, particularly price momentum and trend following, remain important components of modern quantitative investing.
The question, therefore, is not simply whether technical analysis works.
It is whether traditional chart reading and scientifically testable market signals are really the same thing.
1. What is technical analysis?
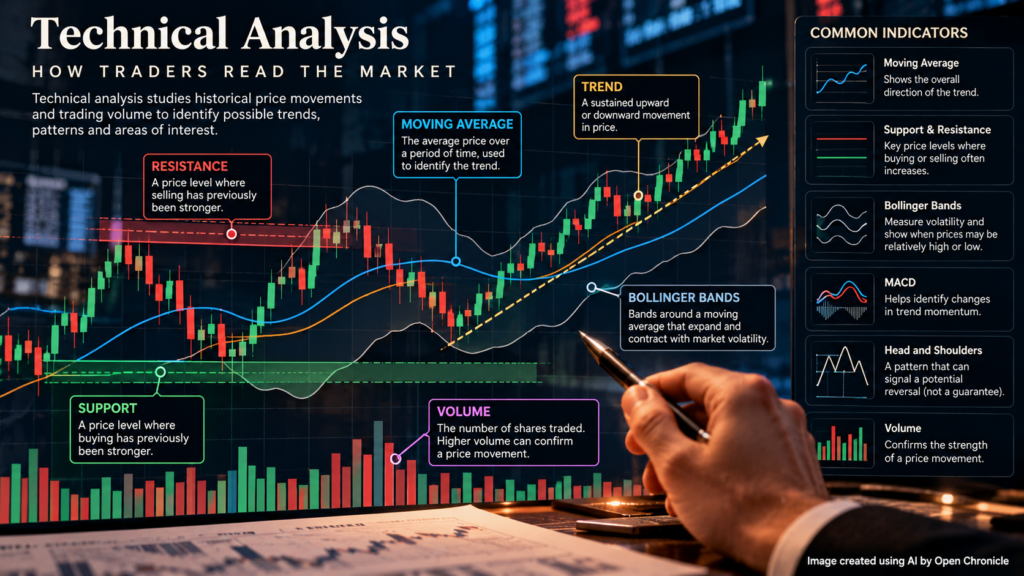
Technical analysis is the study of historical market prices, trading volumes and related indicators in an attempt to understand or anticipate future price movements.
Unlike fundamental analysis, which investigates what an asset might be worth, technical analysis concentrates on how the asset is trading.
A fundamental analyst studying a company might examine its profitability, debt, competitive position and expected future earnings.
A technical analyst might examine whether its share price is rising, whether trading volume is increasing and whether previous price levels have attracted buyers or sellers.
The traditional approach rests on several propositions:
Market prices reflect the interaction of buyers and sellers.
Trends can persist rather than reverse immediately.
Investors sometimes react in predictable behavioural patterns.
Historical prices may contain useful information about market positioning and sentiment.
These propositions do not necessarily imply that markets can be predicted with certainty.
Instead, technical analysts attempt to identify circumstances in which one outcome may be more probable than another.
The distinction matters because a probabilistic trading strategy can still lose money frequently, even if it has a genuine statistical advantage.
2. Before computers: when market prices told the story

Technical analysis emerged long before electronic trading.
Charles Dow, one of the founders of Dow Jones & Company, helped establish an early framework for studying market trends around the turn of the twentieth century.
Dow Theory developed the idea that markets move through identifiable trends and that movements across different market averages can help confirm broader economic conditions.
In an era when financial information travelled slowly, price and volume data were among the most accessible signals available to traders.
One of the most famous figures associated with this approach was Jesse Livermore, the American speculator whose career spanned the late nineteenth and early twentieth centuries.
Livermore studied ticker-tape information, market movements and the behaviour of other traders. He became famous for spectacular gains, including during the 1929 market collapse, but also suffered repeated financial reversals.
His career illustrates both sides of speculative trading.
Reading market behaviour could sometimes produce enormous profits. It could also expose traders to devastating losses.
The popular book Reminiscences of a Stock Operator, written by Edwin Lefèvre and published in 1923, drew heavily on Livermore’s experiences.
It helped establish a lasting image of the trader as someone who could interpret the market’s psychology through its price movements.
For decades, that image occupied a central place in financial culture.
3. The academic challenge: can yesterday’s prices predict tomorrow’s?
The intellectual foundations of technical analysis came under pressure as modern financial economics developed.
The efficient-market hypothesis, strongly associated with economist Eugene Fama, argued that asset prices incorporate available information.
In its weak form, the hypothesis holds that historical price and volume information is already reflected in current prices, making it difficult to earn consistent excess risk-adjusted returns from that information alone.
This was a direct challenge to technical analysis.
If markets efficiently incorporate past trading information, why should a moving average or a price pattern reveal a profitable opportunity?
But the academic evidence turned out to be more complicated.
The 1992 study that challenged conventional wisdom
In 1992, William Brock, Josef Lakonishok and Blake LeBaron published an influential paper examining technical trading rules using historical Dow Jones Industrial Average data.
Their research tested moving-average and trading-range breakout strategies over a long historical period.
The findings suggested that certain simple trading rules were associated with return patterns that conventional statistical models struggled to explain.
This did not prove that technical analysis could consistently generate profits after transaction costs, risk adjustments and changes in market conditions.
Nevertheless, it raised an important question: perhaps some information contained in past prices was not entirely irrelevant.
Momentum enters the debate
In 1993, Narasimhan Jegadeesh and Sheridan Titman published another influential study, showing that stocks with relatively strong recent performance had, historically, tended to outperform stocks with weaker recent performance over certain subsequent holding periods.
This phenomenon became known as the momentum effect.
Momentum is not identical to traditional chart reading.
It can be defined mathematically, tested systematically and applied across large portfolios without requiring an analyst to recognise visual patterns.
But its underlying intuition is familiar to technical traders: prices sometimes continue moving in the same direction.
The discovery helped open the door to an important transformation.
Ideas once associated with chartists could be studied as measurable investment factors.
4. Why promising trading strategies often disappear
There is a fundamental problem with testing technical indicators.
A researcher can examine thousands of combinations of moving averages, trading windows, stop-loss rules and chart patterns.
Eventually, some strategies will appear remarkably successful simply by chance.
This is known as data mining, or, in modern machine-learning terminology, a form of overfitting.
Consider a researcher who tests 10,000 trading strategies against historical stock-market data.
Even if none possesses a genuine predictive advantage, some will produce attractive results purely because of random variation.
The problem becomes worse when researchers repeatedly adjust their models after seeing the results.
A strategy might look impressive when tested against the past but perform poorly when confronted with new data.
In 2000, economist Halbert White introduced a statistical approach known as the Reality Check for Data Snooping, designed to account for the effects of evaluating multiple competing trading rules.
This represented an important step towards more rigorous testing.
However, statistical corrections cannot automatically solve every problem.
Researchers may fail to document unsuccessful experiments. Historical datasets can contain survivorship bias. Transaction costs can eliminate small theoretical advantages. A profitable relationship can disappear after becoming widely known.
Modern financial research therefore places considerable emphasis on out-of-sample testing, realistic costs and robustness across different market environments.
The central lesson is straightforward:
A strategy that explains yesterday’s market is not necessarily a strategy that can profit from tomorrow’s market.
5. The rise of the quants: when mathematics replaced intuition

During the 1980s and 1990s, financial markets experienced a technological revolution.
Computers became more powerful, historical data became easier to access and investment firms began employing specialists capable of constructing complex statistical models.
These researchers became known as quants, short for quantitative analysts.
Rather than relying on a visual interpretation of charts, quantitative analysts could evaluate thousands of securities, compare numerous variables and test investment hypotheses systematically.
The contrast was striking.
A traditional chartist might identify a potential breakout by studying a single price chart.
A quantitative researcher could examine whether a precisely defined breakout strategy had historically generated returns across hundreds of assets, multiple countries and different economic environments.
This did not necessarily make quantitative investing superior in every circumstance.
It did, however, change what counted as persuasive evidence.
Financial institutions increasingly wanted investment strategies that could be documented, tested, replicated and monitored.
The warning from Long-Term Capital Management
The rise of quantitative finance was not without spectacular failures.
Long-Term Capital Management became one of the most famous examples.
Founded in 1994, the hedge fund employed sophisticated financial models and attracted prominent figures, including Myron Scholes and Robert Merton, who received the 1997 Nobel Memorial Prize in Economic Sciences.
Its strategies relied heavily on relative-value trading, leverage and the expectation that certain financial price relationships would converge.
When markets experienced severe turbulence following the Russian financial crisis of 1998, LTCM suffered enormous losses and required a private-sector rescue coordinated by the Federal Reserve Bank of New York.
The lesson was not that mathematics was useless.
It was that sophisticated models could still underestimate liquidity problems, extreme events and the consequences of crowded investment positions.
In other words, replacing chart-reading intuition with equations did not eliminate financial uncertainty.
6. Financial crises brought fundamental analysis back into focus
The late 1990s and early 2000s also exposed the dangers of investing without understanding the underlying assets.
The Asian financial crisis of 1997 revealed weaknesses involving excessive borrowing, fragile banking systems and corporate governance.
The collapse of the dotcom bubble in 2000 demonstrated how market enthusiasm could push valuations far beyond what many companies’ business models could support.
Accounting scandals involving Enron, WorldCom and Parmalat subsequently reinforced the importance of financial reporting, corporate oversight and independent research.
These episodes strengthened the argument for fundamental analysis.
Investors needed to understand what companies owned, how they generated revenue, whether their financial statements were reliable and how much debt they carried.
A rising share price could not answer those questions.
Nor could a moving average reveal hidden accounting fraud.
The distinction between price and value became particularly important.
A stock might display an attractive upward trend while the underlying company was becoming financially weaker.
Conversely, a financially sound business might experience a temporary decline in its share price.
Technical analysis could help describe market behaviour, but it could not replace due diligence.
7. Technical analysis versus quantitative analysis: what is the difference?
The boundary between the two approaches is less clear than it first appears.
| Traditional technical analysis | Quantitative analysis |
|---|---|
| Often relies on visual chart interpretation | Relies on explicitly defined mathematical rules |
| May identify support, resistance and patterns | Tests measurable variables across datasets |
| Can involve discretionary judgement | Often uses systematic decision processes |
| Results may depend on the individual analyst | Methods can be independently replicated |
| Common among individual traders | Widely used in institutional research and systematic investing |
These are general distinctions, not absolute categories. Some technical strategies are entirely systematic, while quantitative investors can also exercise considerable judgement.
A simple moving-average strategy, for example, can belong to either tradition.
If an investor looks at a chart and decides that a trend appears promising, the decision is discretionary.
If a computer buys whenever a specified moving average crosses another and follows an explicitly defined exit rule, the strategy becomes systematic.
The underlying price information is the same.
What changes is the method of interpretation and testing.
8. The surprising survival of momentum
One of the strongest arguments against declaring technical analysis completely obsolete is the continued academic interest in momentum.
Momentum strategies attempt to exploit the historical tendency of some assets to continue performing in the same direction over certain periods.
There are several explanations for why this might occur.
Investors may react slowly to new information. Institutional constraints may delay portfolio adjustments. Market participants may imitate one another, reinforcing existing trends.
But momentum can also experience abrupt reversals, particularly when crowded positions unwind.
A 2012 study by Tobias Moskowitz, Yao Hua Ooi and Lasse Heje Pedersen examined time-series momentum across equity-index, currency, commodity and bond futures. It documented historical return persistence over intermediate horizons, alongside partial reversals over longer periods.
This evidence is significant because it demonstrates that past prices can sometimes contain statistically useful information.
It does not mean every technical indicator works, nor that momentum strategies are guaranteed to outperform after costs and risk.
The more defensible conclusion is that some price-based patterns deserve scientific investigation.
9. Why artificial intelligence does not make charts irrelevant

Artificial intelligence adds another dimension to the debate.
Machine-learning systems can examine far more variables than a human chartist could reasonably process.
They can identify nonlinear relationships, combine market information with economic indicators and analyse alternative datasets.
But AI does not remove the underlying difficulty of financial prediction.
Markets are adaptive.
When a profitable relationship becomes widely recognised, investors may trade against it until the advantage diminishes.
An algorithm can also discover patterns that exist only by chance.
This means machine learning remains vulnerable to overfitting, changing market conditions, poor-quality data and unrealistic assumptions about transaction costs.
A highly sophisticated model trained on historical prices may fail when the market enters a previously unseen environment.
The essential challenge is not the sophistication of the technology.
It is whether a proposed advantage survives independent testing and remains economically meaningful.
In this sense, AI has intensified rather than eliminated the questions that surrounded traditional technical analysis.
10. The technical-analysis glossary: what do the indicators actually mean?
Interactive Indicator Guide
Explore eight commonly discussed technical-analysis tools. Select a name below to jump to its explanation, typical use and principal limitation.
Moving Average
Volume
Support & Resistance
Bollinger Bands
MACD
Head and Shoulders
Triple Top
Elliott Waves
Moving Average
The average price over a rolling number of periods. It smooths short-term fluctuations so that the broader direction of a price series is easier to see. Simple and exponential moving averages use different weighting methods.
Common use: Identifying trend direction and comparing shorter-term and longer-term trends.
Limitation: A moving average reacts to prices that have already occurred and can lag behind sudden market changes.
Volume
Trading volume measures the amount of an asset traded over a given period. Analysts compare changes in volume with price movements to assess market participation and the intensity of buying or selling activity.
Common use: Assessing participation during price advances, declines and breakouts.
Limitation: High volume does not, by itself, reveal the motives of traders or establish where prices will move next.
Support & Resistance
Support refers to an area where falling prices have previously met buying interest; resistance refers to an area where rising prices have previously encountered selling interest. These are interpretive zones rather than fixed barriers.
Common use: Identifying historically significant price zones and possible breakout areas.
Limitation: The boundaries can be subjective, and markets frequently move through them.
Bollinger Bands
Bollinger Bands place upper and lower bands around a moving average, typically using a multiple of the rolling standard deviation. The bands widen or narrow as measured price variability changes.
Common use: Describing relative volatility and the position of prices within a recent range.
Limitation: A price touching a band is not automatically a buy or sell signal; strong trends can persist near a band.
MACD
Moving Average Convergence Divergence compares two exponential moving averages. A signal line and histogram are commonly used to illustrate changes in the relationship between short-term and longer-term price momentum.
Common use: Monitoring momentum shifts and trend changes.
Limitation: Crossovers may occur late or repeatedly in sideways markets, producing misleading signals.
Head and Shoulders
A chart formation described as three successive peaks, with the middle peak higher than the two outer peaks. Traditional chartists sometimes interpret it as a possible transition from an upward trend to a downward trend.
Common use: Describing a potential trend reversal.
Limitation: Pattern recognition is subjective, and apparent formations can fail or be identified only in hindsight.
Triple Top
A formation in which a price approaches a similar high on three occasions without sustaining a move above it. Chartists sometimes view this as a sign that an existing upward trend may be weakening.
Common use: Examining repeated tests of a resistance area.
Limitation: The three highs may not be clearly defined, and a later breakout can invalidate the interpretation.
Elliott Waves
Elliott Wave theory proposes that market prices unfold in recurring sequences of advancing and corrective waves. Practitioners attempt to classify price movements within these patterns across different time scales.
Common use: Interpreting market cycles and possible phases of a trend.
Limitation: Wave counts are often open to competing interpretations and are difficult to validate consistently.
Editorial Note
No indicator should be interpreted as an independently reliable prediction. The usefulness of any signal depends on its precise definition, the market being studied, transaction costs and the quality of the evidence supporting its application. This guide is for educational purposes and does not constitute investment advice.
OPEN CHRONICLE EXPLAINED · UNDERSTAND HOW THE WORLD WORKS
11. Does technical analysis still have a practical role?
Despite its limitations, technical analysis can still serve several purposes.
First, charts offer an accessible way to visualise market behaviour.
A price chart can quickly reveal whether an asset has been rising, falling or fluctuating within a relatively stable range.
Second, price-based indicators can help investors establish consistent decision rules.
For example, a systematic strategy might use predefined trend conditions to determine when to enter or exit a position.
Third, chart analysis can provide information about market volatility, trading activity and possible liquidity concentrations.
However, none of these applications establishes that a strategy will generate superior investment returns.
For investors, the crucial distinction is between using charts to understand market behaviour and believing that charts can reliably predict future prices.
The first can be useful.
The second requires convincing evidence.
What should investors be cautious about?
The greatest danger is false confidence.
Technical indicators can produce precise-looking signals, but visual precision should not be confused with predictive accuracy.
A chart may display a clearly defined resistance level, yet prices can move beyond it without warning.
A moving-average crossover may appear to identify a new trend, only for the market to reverse immediately.
Transaction costs, taxes, spreads and the psychological difficulty of following a trading system can further reduce performance.
For long-term investors, asset allocation, diversification, valuation, costs and risk tolerance will often matter more than short-term chart patterns.
Technical analysis is therefore better understood as a possible supplementary tool than as a substitute for a coherent investment strategy.
12. The future of chartism: extinction or transformation?
The decline of traditional chartism reflects a broader transformation in financial markets.
Professional investors increasingly demand strategies supported by statistical evidence, transparent methodologies and robust risk management.
The discretionary interpretation of patterns such as head and shoulders or Elliott Waves has struggled to meet those standards consistently.
Yet some of the ideas historically associated with technical analysis have survived.
Momentum, trend following and other price-based signals have become subjects of systematic academic research and quantitative investment strategies.
The chart has not disappeared.
Its role has changed.
Instead of serving as an almost mystical guide to future prices, it can function as a visual representation of measurable market behaviour.
The strongest applications are those that can be clearly defined, tested and evaluated against realistic alternatives.
The Big Question: Is technical analysis dead?
The answer depends on what we mean by technical analysis.
If chartism means believing that subjective visual patterns can consistently reveal where markets will move next, the evidence provides little reason for confidence.
If technical analysis means studying historical prices to identify measurable tendencies, its intellectual legacy remains very much alive.
Modern quantitative finance has absorbed some of its most testable ideas while rejecting many of its less rigorous claims.
That is the real transformation.
Finance did not entirely abandon the study of market prices. It increasingly demanded proof that the patterns being studied were more than coincidence.
Sources and Further Reading
Academic research and further reading on technical analysis, market efficiency, momentum investing, quantitative finance and the influence of randomness on financial markets.
Brock, Lakonishok & LeBaron (1992)
Simple Technical Trading Rules and the Stochastic Properties of Stock Returns. The Journal of Finance. An influential academic investigation of technical trading rules and historical stock-market returns.
Jegadeesh & Titman (1993)
Returns to Buying Winners and Selling Losers: Implications for Stock Market Efficiency. The Journal of Finance. A landmark study examining momentum effects and their implications for market efficiency.
White (2000)
A Reality Check for Data Snooping. Econometrica. A methodological contribution addressing statistical biases that can arise when researchers test numerous competing models or trading strategies.
Moskowitz, Ooi & Pedersen (2012)
Time Series Momentum. Journal of Financial Economics. An empirical study examining the persistence of price trends across different asset classes and the role of momentum in systematic investment strategies.
Nassim Nicholas Taleb (2001)
Fooled by Randomness. A discussion of chance, survivorship bias and the tendency to mistake luck for investment skill. The book provides a broader perspective on uncertainty and the interpretation of financial success.
This article is an educational explanation of technical analysis and its relationship with academic finance and quantitative investing. It does not provide investment recommendations or endorse particular trading strategies. Historical research findings do not guarantee future investment performance. Readers should consider market risks, transaction costs and their individual circumstances before making financial decisions.
·
UNDERSTAND HOW THE WORLD WORKS
Understanding the systems behind the headlines.
Explore Open Chronicle Explained →