
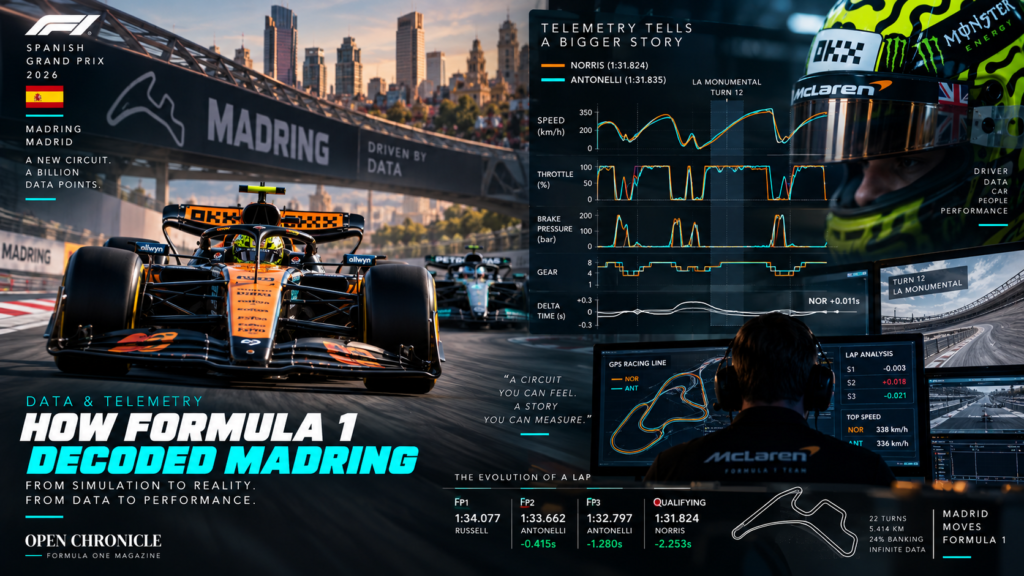
Before Friday morning, Formula 1 teams knew Madring primarily through simulation. By Saturday afternoon, Lando Norris had produced a 1:31.824 pole lap, 2.253 seconds faster than the opening practice benchmark. Between those two moments came thousands of kilometres of accumulated information, as engineers transformed braking traces, GPS positioning, tyre behaviour, energy deployment and driver feedback into an understanding of a circuit Formula 1 had never raced before.
By Open Chronicle Formula One Magazine
Formula One arrived in Madrid with an unusual problem.
The teams knew Madring.
But they did not truly know Madring.
They had circuit maps, simulations, vehicle models, predicted racing lines and enormous quantities of engineering preparation. They could estimate aerodynamic loads, calculate expected speeds and prepare initial setups long before a Formula One car entered the circuit.
What they did not possess was something teams take almost for granted at places such as Silverstone, Suzuka and Monza.
Real Formula One history.
There were no previous Grand Prix telemetry traces to examine. No previous season’s setup to reopen. No historical tyre degradation curves from which to establish an immediate baseline.
When FP1 began, prediction finally met measurement.
And every lap started teaching Formula One something new.
The Digital Madring Came First
Long before the first practice session, Madring already existed inside computers.
Modern Formula One preparation allows teams to model a circuit before physically driving it. Geometry, corner radius, elevation, expected grip and other characteristics can be incorporated into simulations that help engineers establish a starting setup.
Pirelli followed a similar process when preparing for Madrid.
The tyre supplier studied the circuit before its World Championship debut, using its geometry to model racing lines and estimate the forces that would act on the tyres. Once the physical surface became available, engineers could measure characteristics of the asphalt and refine those predictions.
Madring was expected to be particularly demanding. Pirelli placed it among the five circuits generating the greatest energy through the tyres, while La Monumental was expected to create exceptionally high vertical loads.
But models remain models.
Friday morning was when the digital Madring had to confront the physical one.
FP1: Establishing Reality
George Russell set the first major benchmark.
1:34.077.
Kimi Antonelli followed with a 1:34.363.
Charles Leclerc recorded 1:34.536.
Lewis Hamilton produced 1:34.620.
Max Verstappen completed the early leading group with 1:34.703.
For spectators, those numbers created a classification.
For engineers, they created questions.
Where was Russell finding his advantage?
Was Mercedes carrying more speed through a particular corner sequence?
Was Ferrari stronger under braking?
Was Verstappen losing time because of balance, tyres, energy use or simply the timing of his run?
How much performance was available as the track accumulated rubber?
The lap time could tell Mercedes that Russell was fastest.
It could not tell Mercedes why.
That is where data becomes essential.
A Formula One Lap Is a Digital Fingerprint
A modern Formula One car is effectively a moving measurement platform.
Hundreds of sensors monitor different aspects of its operation, generating an extraordinary volume of information. Formula One’s technology partnership with AWS describes roughly 300 sensors on a modern car and more than a million telemetry data points per second across the cars.
Those measurements can help teams analyse areas such as speed, braking, throttle application, vehicle behaviour, temperatures, power unit operation and energy use.
Combine that information with GPS positioning and a lap becomes much more than a number.
It becomes a trace.
Consider a single corner.
The engineer can examine where braking begins, how speed falls, how the car approaches the apex, when the driver releases the brake, when throttle application begins and how quickly the car accelerates away.
Then that trace can be compared with another lap.
Or another driver.
That is where the invisible performance begins to appear.
The Stopwatch Can Hide Two Completely Different Laps
Two drivers can complete a sector in exactly the same time while driving it very differently.
One might brake later but reduce speed more aggressively.
Another might brake earlier, release the pedal more progressively and carry greater minimum speed.
One car might gain through the corner.
The other might recover the time on the following straight.
At the timing line they appear equal.
Telemetry can reveal that they were almost never equal during the sector.
This is why engineers compare multiple channels rather than treating the final time as the complete answer.
A speed trace shows where velocity changes.
A braking trace helps reveal how the driver approaches the corner.
A throttle trace shows how acceleration is applied.
GPS data provides the spatial context.
And the delta shows where one lap begins gaining or losing against another.
Madring was producing these digital fingerprints for the first time.
Friday Revealed Different Performance Profiles
As more laps accumulated, another important characteristic emerged.
The leading cars were not producing their performance in identical ways.
Friday analysis suggested Ferrari was particularly competitive through the first sector, while Verstappen and Red Bull showed strength through the faster second part of the lap.
Mercedes demonstrated an important advantage later around the circuit, including strong speed characteristics through the final sector. Analysis of the Friday running also indicated differences in how electrical energy was being used across the lap.
McLaren, meanwhile, did not initially look like the obvious benchmark.
That is an important distinction.
A classification tells us which car completed the entire lap fastest.
Sector and telemetry analysis begin revealing what kind of car produced that time.
Energy Changes the Meaning of Speed
The 2026 Formula One regulations make this particularly interesting.
Electrical energy management has become a major component of overall performance.
A car that appears slower at one point on a straight does not automatically possess less performance.
The team may be deploying its available energy differently.
More deployment in one section can influence what remains available elsewhere.
Energy recovery introduces another layer.
Consequently, engineers cannot always look at a speed difference and conclude:
Car A has less power than Car B.
They need context.
Was the driver harvesting energy?
Was deployment being conserved?
Was the car approaching the energy limit differently?
Was the lap intended to simulate qualifying or race conditions?
This is one reason telemetry interpretation is much more complicated than simply overlaying two speed traces.
FP2: The Baseline Moves
By Friday afternoon, the circuit was already changing.
Antonelli produced:
1:33.662.
Leclerc was just 0.113 seconds behind.
Hamilton followed at 0.149.
Russell, fastest in FP1, recorded 1:33.999.
The benchmark had fallen by 0.415 seconds.
But even that comparison requires caution.
The track was evolving.
Fuel loads could differ.
Tyres differed.
Drivers were becoming more confident.
Teams had changed setups.
Energy deployment could vary between programmes.
The engineer’s job was therefore not merely to notice that the lap had become faster.
It was to determine why it had become faster.
The Circuit Was Changing Beneath the Cars
Madring’s new surface made track evolution particularly significant.
Every Formula One lap deposited more rubber onto a racing surface that had little previous high performance running.
Grip changed.
Drivers learned where they could attack.
Braking references became more precise.
The racing line developed.
That means a direct comparison between two laps separated by several hours can be misleading.
Suppose a setup change produces a gain of two tenths.
If track evolution independently contributes another three tenths, the stopwatch might suggest the setup gained half a second.
It did not.
Formula One data analysis is partly the science of separating these effects.
When Simulation Meets a Bumpy Reality
One of Friday’s most revealing lessons came from the difference between simulation and the physical circuit.
Red Bull technical director Pierre Waché indicated that the team encountered greater challenges involving mechanical grip and ride than anticipated, while the circuit proved bumpier than expected from simulation. Graining was another factor requiring attention.
That observation explains one of the most important purposes of practice.
Engineers are not simply asking:
How fast are we?
They are asking:
Where is reality different from our model?
A discrepancy in ride behaviour can affect several systems.
Unexpected vertical movement may alter ride height.
Ride height can change aerodynamic performance.
That can affect balance.
Balance changes how the driver uses the steering and throttle.
Those changes influence tyre loading.
Suddenly a physical characteristic of the circuit that appeared slightly different from simulation is influencing lap time, tyre behaviour and driver confidence.
Telemetry provides the evidence needed to trace that chain.
Driver Feedback Remains Essential
None of this makes the driver obsolete.
Quite the opposite.
Imagine a driver returning to the garage and reporting instability at the rear through a particular corner.
The engineers now have a hypothesis.
They can inspect the relevant lap.
Did the steering trace show corrections?
Was throttle application delayed?
Was there unusual wheel behaviour?
Was the car moving vertically?
Did wind change?
Were the tyres in the same condition as the previous run?
Driver feedback gives the data context.
Data gives the feedback measurement.
Formula One engineering works because the two communicate.
La Monumental: A Corner Becomes a Laboratory
No part of Madring demonstrates this better than La Monumental.
The long banked Turn 12 is the circuit’s most recognisable feature, with banking reaching approximately 24 percent. Pirelli expected it to generate the highest vertical tyre loads of the season.
To spectators, it is spectacular.
To engineers, it is a laboratory.
One passage can provide information about speed, steering demand, throttle position, vehicle movement, tyre behaviour, energy use and racing line.
Then comes another lap.
The comparison begins.
Antonelli against Antonelli.
Antonelli against Russell.
Medium against Soft.
Low fuel against high fuel.
Friday against Saturday.
A single corner can generate dozens of meaningful comparisons.
Two Mercedes Cars, Two Experiments
Mercedes had another powerful source of information.
Two drivers.
Russell led Antonelli by 0.286 seconds in FP1.
In FP2 the relationship reversed.
Antonelli’s 1:33.662 beat Russell’s 1:33.999 by 0.337 seconds.
That provides engineers with an unusually useful comparison because many variables can be controlled more effectively within the same team.
They can ask where Russell brakes relative to Antonelli.
Who carries more speed into a corner?
Who reaches the throttle earlier?
Does one technique generate a better exit?
Which driver is kinder to the tyres?
Does a setup direction work better over one lap but become weaker during a longer run?
Friday practice is therefore not simply two drivers attempting to record the fastest time.
It is two simultaneous experiments.
Tyres Leave Their Own Signature
Data also helps engineers identify how tyre performance changes.
Imagine the same driver approaching the same corner repeatedly.
Initially, minimum speed remains stable.
Several laps later, the driver needs additional steering correction.
Throttle application moves later.
Exit speed falls.
Lap time begins drifting.
No single signal necessarily proves tyre degradation.
But when multiple channels begin changing together, a pattern develops.
Engineers can combine those trends with temperatures, pressures, lap times, tyre observations and driver feedback.
This is why tyre strategy and telemetry are closely connected.
Strategy decides when to act.
Data helps explain what is happening.
FP3: Another Second Disappears
Saturday produced another major step.
Antonelli recorded:
1:32.797.
Leclerc was 0.166 seconds behind.
Oscar Piastri followed at 0.189.
Norris was 0.236 away.
Verstappen was 0.375 behind.
Relative to Russell’s opening FP1 benchmark, Antonelli had already found 1.280 seconds.
But FP3 also demonstrated why data gathering cannot always proceed according to plan.
Hamilton crashed at Turn 22.
The session was interrupted.
Later Oliver Bearman suffered another accident, bringing further disruption.
Every red flag reduces running.
That means fewer laps.
Fewer tyre samples.
Fewer setup comparisons.
Less long run information.
When track time disappears, previously collected data becomes even more valuable.
Friday Night: Where Data Becomes Performance
One of the most important phases of the Madring weekend happened when no cars were circulating.
Friday night.
Teams now had something they had never possessed before.
Real Formula One data from Madring.
The information could be compared against simulation.
Engineers could investigate where expected loads matched reality, where ride behaviour differed, where drivers lacked confidence, where tyre performance deteriorated and where energy deployment might be optimised.
The process is not simply a matter of opening a laptop and searching for the fastest lap.
Data must be interpreted.
A lap affected by traffic is not equivalent to a clean lap.
A yellow flag may force a driver to lift.
A kerb strike can create an anomalous signal.
Fuel loads vary.
Tyre age varies.
Track conditions vary.
This is why raw data and useful information are not the same thing.
The engineering advantage comes from knowing the difference.
Then McLaren Changed the Competitive Picture
Friday had not made McLaren the obvious favourite.
Norris had also lost practically all of FP2 because of a gearbox related problem.
Then qualifying arrived.
Norris produced:
1:31.824.
Antonelli:
1:31.835.
Verstappen:
1:31.964.
Hamilton:
1:32.013.
Leclerc:
1:32.019.
Four teams had placed cars within approximately two tenths of pole.
And the gap between the fastest two cars was almost absurdly small.
0.011 seconds.
The circuit that Formula One had been attempting to understand on Friday morning had produced an extraordinarily compressed qualifying contest by Saturday afternoon.
Anatomy of 0.011 Seconds
Eleven thousandths of a second is where Data & Telemetry becomes most compelling.
The classification gives us two numbers.
| Driver | Team | Q3 Time | Gap |
|---|---|---|---|
| Lando Norris | McLaren | 1:31.824 | Pole |
| Kimi Antonelli | Mercedes | 1:31.835 | +0.011 |
That is the public result.
Inside the engineering environment, the comparison is far richer.
Imagine the delta moving continuously around Madring.
Antonelli gains under one braking event.
Norris recovers through the corner exit.
Mercedes gains somewhere else.
McLaren responds through another sequence.
The advantage moves backwards and forwards until the timing line freezes it.
0.011.
Without access to the complete private telemetry channels of McLaren and Mercedes, it would be wrong to claim precisely where Norris gained those eleven thousandths.
That distinction is important.
Public data can help us understand performance.
Private team telemetry contains a much deeper layer.
The final timing screen gives everyone the answer.
Only the teams possess the complete explanation.
Norris Found Seven Tenths When It Mattered
Norris provided another remarkable clue after qualifying.
He said his final Q3 attempt represented an improvement of roughly seven to seven and a half tenths and described it as probably one of the best laps of his career.
That enormous improvement illustrates how lap time is created from several interacting factors.
Driver confidence.
Tyre preparation.
Track evolution.
Braking commitment.
Racing line.
Setup.
Energy use.
Execution.
A car does not necessarily become seven tenths mechanically faster between two runs.
The driver and team simply become better at extracting what is available.
From 1:34.077 to 1:31.824
The weekend progression tells the story.
| Session | Fastest Driver | Fastest Lap | Gain From FP1 |
|---|---|---|---|
| FP1 | George Russell | 1:34.077 | Baseline |
| FP2 | Kimi Antonelli | 1:33.662 | 0.415s |
| FP3 | Kimi Antonelli | 1:32.797 | 1.280s |
| Qualifying | Lando Norris | 1:31.824 | 2.253s |
In less than two days, the headline benchmark improved by 2.253 seconds.
It would be wrong to describe that as 2.253 seconds of car development.
It was a combination.
The circuit improved.
Fuel loads changed.
Tyre preparation became more aggressive.
Drivers learned.
Setups evolved.
Qualifying conditions differed from practice.
Energy could be deployed differently.
Confidence increased.
And the teams became better at understanding Madring.
The task of the data engineer is to separate those variables as far as possible.
The Data Does Not Drive the Car
There is an important technological boundary.
Formula One teams receive enormous amounts of information from their cars, but telemetry does not mean engineers remotely control them.
The FIA regulations define the permitted telemetry architecture and tightly restrict communication and control in the opposite direction.
The garage can monitor.
Engineers can interpret.
The team can communicate with the driver.
But the driver remains responsible for controlling the Formula One car.
This is one of the most important distinctions between data acquisition and vehicle control.
The car tells the engineers what it is doing.
The engineers use that information to decide what should happen next.
The FIA Is Part of the Data Ecosystem
Teams are not the only organisations interested in Formula One data.
The FIA also requires specified information for technical and regulatory purposes.
Telemetry and logging therefore contribute not only to performance engineering but also to technical compliance, safety monitoring and investigations.
Different groups look at data for different reasons.
Teams seek performance.
Drivers seek understanding.
The FIA seeks oversight and compliance.
Broadcast systems seek information that can help explain the competition to spectators.
The underlying resource is the same.
Measurement.
From Sensor to Lap Time
The process can be simplified into a continuous engineering cycle:
Sensor → Data Acquisition → Telemetry → Processing → Comparison → Interpretation → Setup Decision → Driver Execution → New Data
Then it begins again.
A wing adjustment creates another data set.
A suspension change produces another comparison.
A different tyre preparation procedure creates another experiment.
A driver changes the way a corner is approached.
Another trace appears.
Observe.
Interpret.
Change.
Measure again.
This cycle continued throughout Formula One’s first weekend at Madring.
What Madrid Really Demonstrated
Madring provided an unusually clear demonstration of why data matters because every team began without historical Formula One race experience at the circuit.
There was no previous Madrid Grand Prix from which engineers could simply retrieve a proven setup.
Simulation provided the starting point.
FP1 challenged it.
FP2 expanded the data set.
Friday night transformed information into decisions.
FP3 provided another test.
Qualifying delivered the result.
By then, Mercedes, McLaren, Red Bull and Ferrari had converged to within fractions of a second.
That did not happen because every team suddenly built a new car overnight.
They learned how to use the cars they already had on a circuit they were progressively beginning to understand.
Data & Telemetry Verdict
The first Madring weekend demonstrated the difference between knowing a circuit digitally and understanding it competitively.
George Russell’s 1:34.077 established the first Friday benchmark.
Antonelli moved it to 1:33.662.
Then to 1:32.797.
Finally Norris produced 1:31.824.
2.253 seconds disappeared between FP1 and pole.
Some came from track evolution.
Some came from tyres.
Some came from fuel and energy conditions.
Some came from setup.
Some came from driver learning and commitment.
And some came from engineers taking the information produced by one lap and using it to make the next lap better.
That is the real purpose of Formula One telemetry.
Not simply to collect numbers.
To turn measurement into understanding.
And understanding into performance.
When Norris eventually defeated Antonelli by only 0.011 seconds, Madring delivered the perfect conclusion to Formula One’s first weekend of learning.
The stopwatch told Formula One who was fastest.
The data helped Formula One understand why.